Overview(Long version)
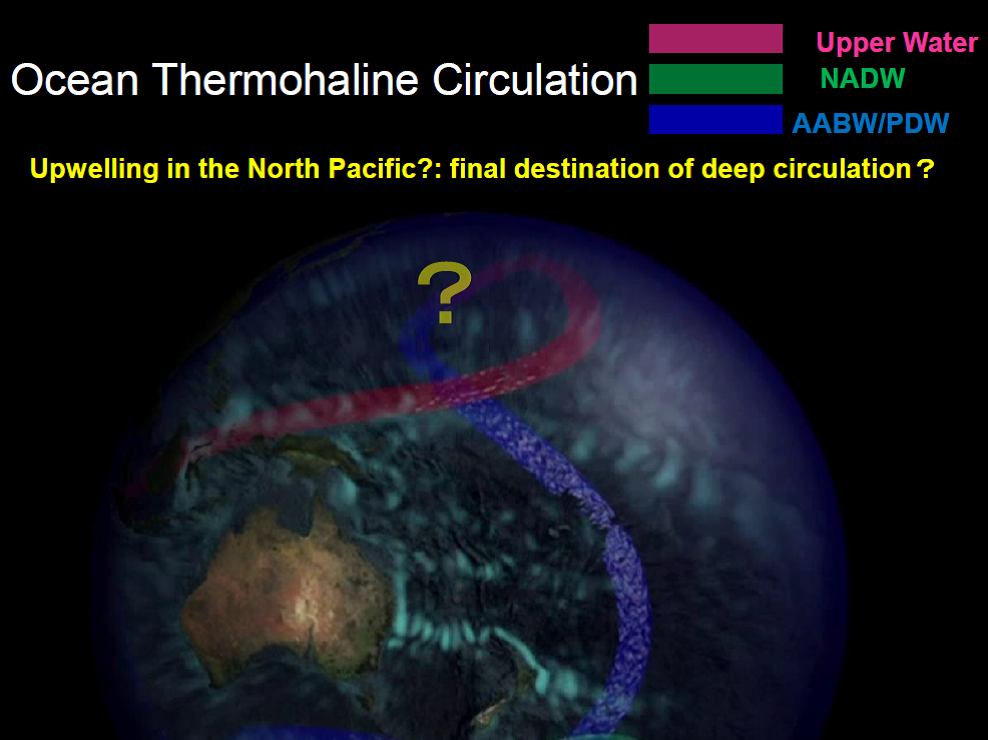
World Ocean Circulation starts from the deep water sinking in the high latitude North Atlantic. North Atlantic Deep Water (NADW) flows southward along this green belt, and eastward in the Southern Ocean where NADW is modified around the Antarctica to be Pacific Deep Water (PDW). PDW flows northward in the Pacific along this blue band, and upwells to surface, and then returns to the North Atlantic as warm surface water along this red band. In the North Pacific where no deep water is formed and is the final destination of the deep circulation, deep water upwells but this upwelling is not well understood.
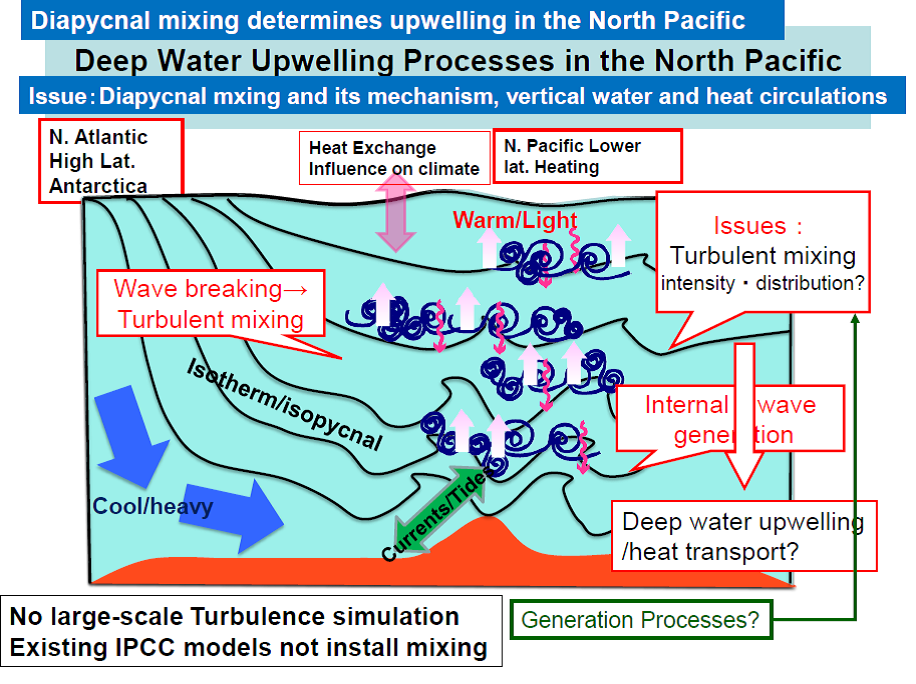
Let me explain the upwelling processes of the North Pacific deep water. When currents as tides override rough bottom topography, internal waves are generated. When the amplitude of this internal wave becomes large and the wave breaks, turbulent eddies mix waters vertically. This vertical mixing transports heat downward from surface, and makes deep water light and maintains deep water upwelling. This heat transport influences on climate through surface heat exchange with the overlying atmosphere. Here issues are that we do not know the turbulence intensity distribution and generation mechanisms and thus we do not know how and where the deep water upwells in the North Pacific. Even at present, large-scale turbulence numerical simulations are not possible, turbulent mixing distribution has not been installed in the existing climate models including IPCC models, whose heat transport could be NOT true. This project challenges to elucidate North Pacific vertical mixing and vertical transport of deep water and heat.
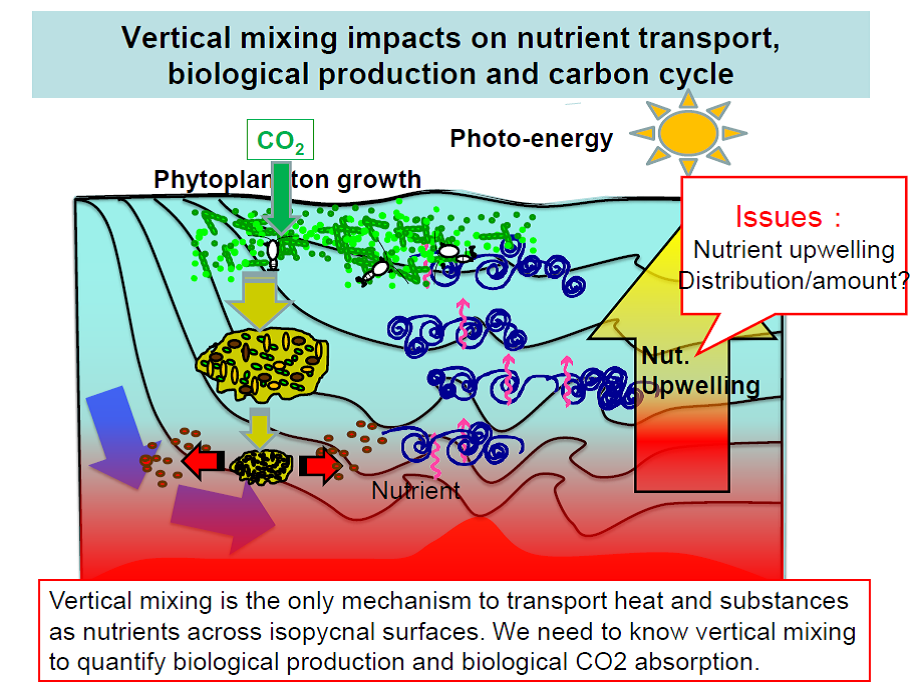
Vertical mixing influences on biological production and carbon cycles through nutrient vertical transport. Nutrient concentration is high in the deep North Pacific where is the end of deep circulation and nutrients are accumulated. Vertical mixing acts to uplift and supply the deep nutrient to upper ocean. Photo-synthesis enhances phytoplankton growth by using carbon in the water and then absorb atmospheric CO2 to compensate lowered carbonate density. Dead body and feces sink down as particulate organic matters (POC), and decomposed and re-mineralized in the deep oceans where nutrient concentration is increased. The problem is that we cannot quantify nutrient upwelling and amount because we do not know vertical mixing. Vertical mixing is the only mechanism to transport heat and substances as nutrients across isopycnal surfaces. We need to know vertical mixing to quantify biological production and biological CO2 absorption.
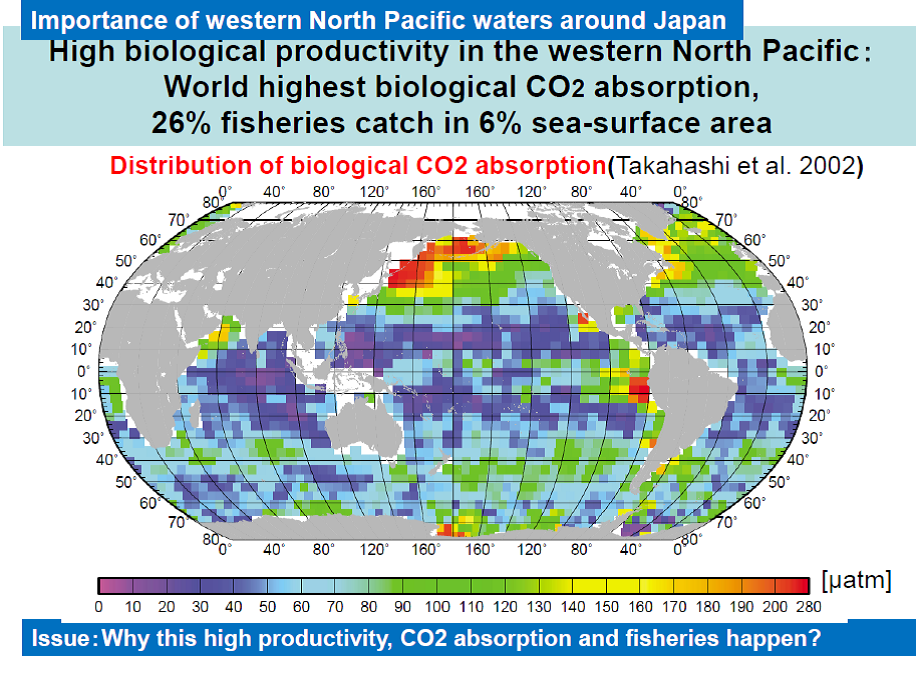 This figure shows the distribution of biological CO2 absorption. Western North Pacific, especially around Japan, is the world highest biological CO2 absorption area, and also the very productive area of fisheries: 26% catch in 6% surface area in the world oceans. This project challenges the issues how this high biological productivity is maintained through elucidating vertical mixing processes.
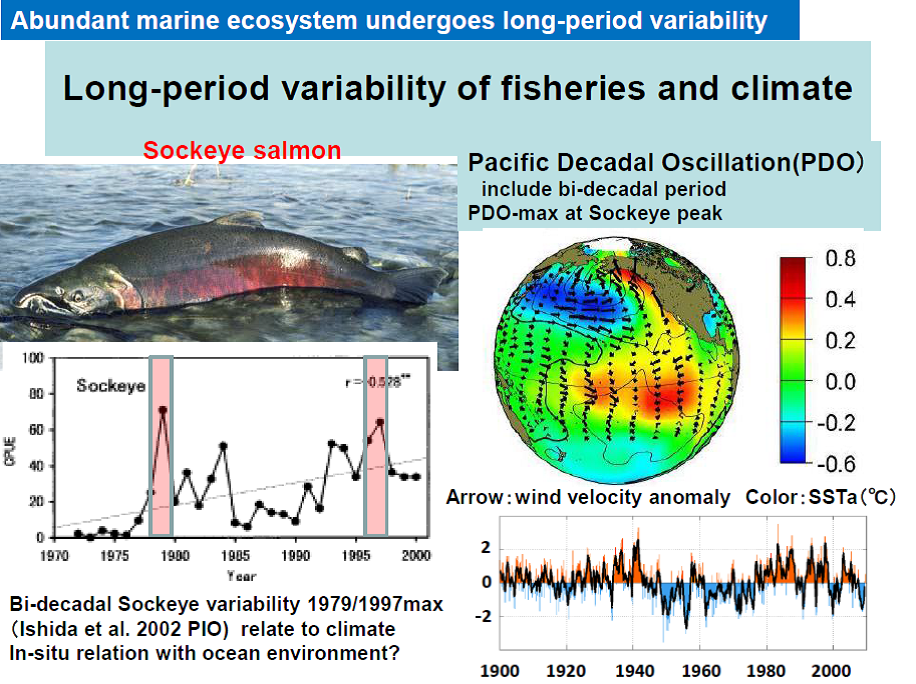
This abundant marine ecosystem around Japan undergoes long-period variability. For example, sock-eye salmon stock undergoes bi-decadal period variability. This kind of long-term fisheries variability is known to relate with climate variability; however, relation with in-situ ocean environment has not been known. North Pacific long-term climate variability is known to be related with PDO (Pacific Decadal Oscillation) patterns as this figure. PDO includes bi-decadal period variability, and the peak of sockeye salmon corresponds to the maximum PDO pattern.
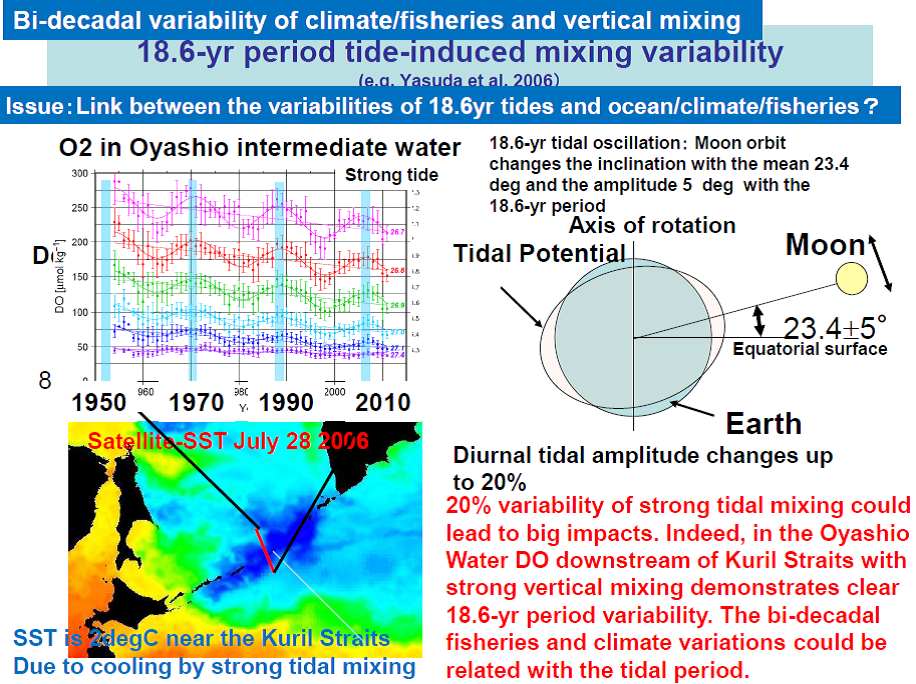
Such climate and fisheries long-period variability is possibly caused by the vertical mixing variability. The long-period vertical mixing variability is caused by the 18.6-yr period tidal oscillation. This tidal oscillation is generated by the 18.6-yr period moon orbital surface variation: inclination is 23.4 degree on average with the variability amplitude of 5 degrees causes up to 20% changes of the diurnal tidal component. In the Kuril Straits, strong diurnal tidal currents induces strong vertical mixing and makes surface cooling by subsurface cold water as shown in this figure, In the numerical simulation for the tidal currents across the Kuril Strait, we can see large turbulent eddies mix waters vertically. If this big mixing changes 20%, big impact could be possible. . Indeed, in the Oyashio Water oxygen concentration downstream of Kuril Straits with strong vertical mixing demonstrates clear 18.6-yr period variability. The bi-decadal fisheries and climate variations could be related with the tidal period. This project challenges to elucidate the link between the tidal oscillation and ocean/climate/ecosystem long-period variability.
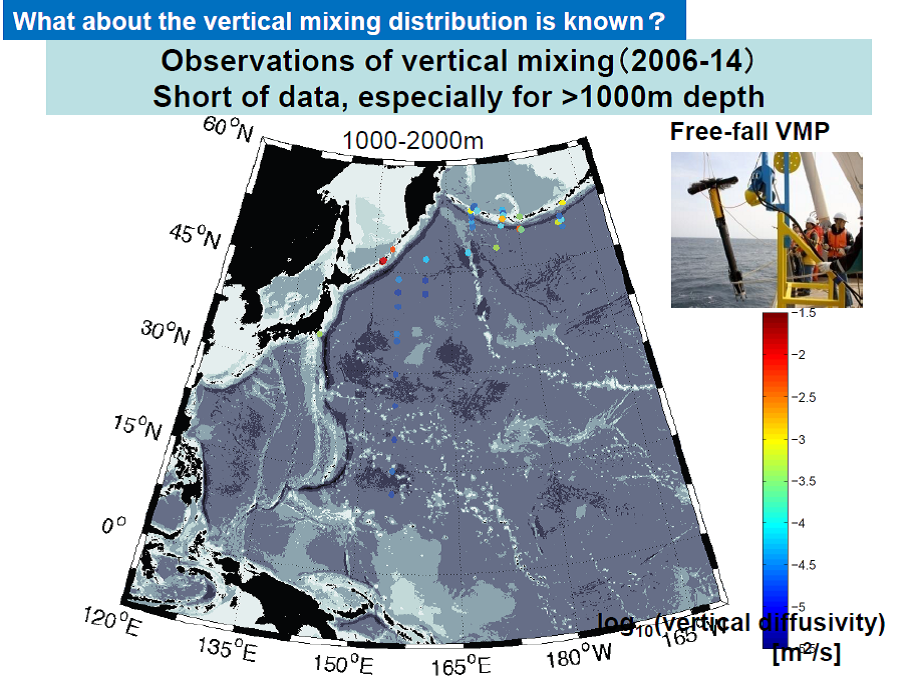 Let me explain the present status of vertical mixing observations. To observe vertical mixing, we use special instruments which detect water turbulent motions with the scale of order mili-meters. Since this observation takes time and special technics, observational data is absolutely shortage. This figure shows the observational stations which measured over 1000m depth during 2006-2014. We can count less than 50 stations.

In this project, we collect data of intermediate-deep vertical mixing by introducing newly developing observational system. We will make practice fast-response thermistor methods to detect temperature microstructure, and attach them to general observational platforms as CTD and perform observations in every research vessel. We made such kind of observation across the entire Pacific along 47-N in the last year of 2014, and obtained high-resolution vertical diffusivity data from surface to bottom and from Japan to the US. As shown in this figure, vertical diffusivity is quite variable and until the 1000m height from bottom and near the seamount and rough bottom topography, about two order of magnitude greater diffusivity were observed. If we use concurrently measured data as temperature and nutrients, we can quantify the vertical flux of heat and nutrients. As shown in these figures, vertical diffusivity distribution deeply connects those flux distribution. In the next 5 years during this project, we are able to obtain data beyond 1000m by utilizing this new method and Japan Meteorological Agency CTD network. On the other hand, these networks do not cover the Kuroshio and Oyashio originating areas and marginal seas where strong vertical mixing are expected.
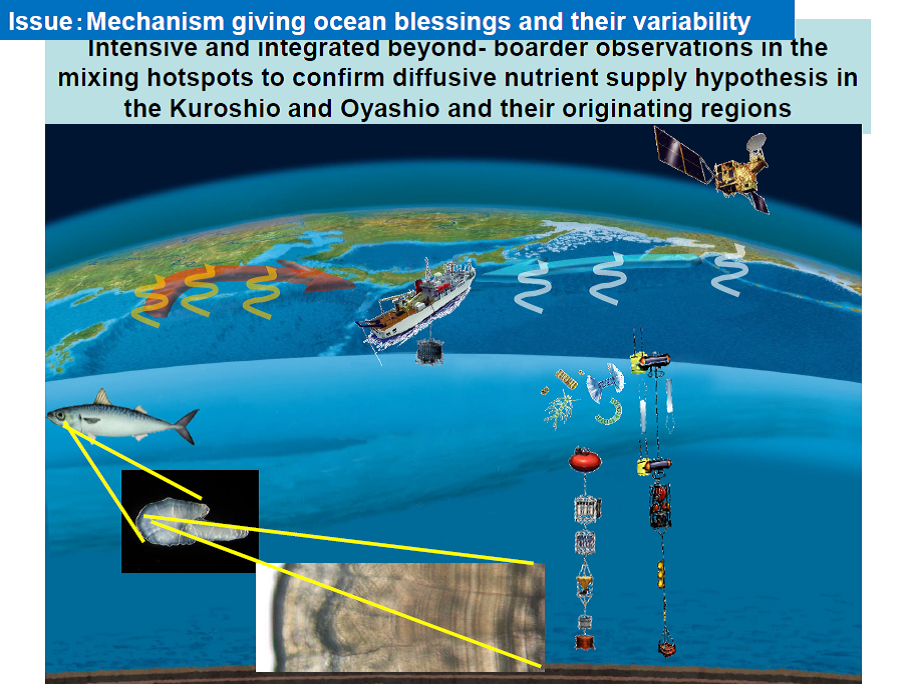 We then perform special physical, chemical and biological integrated in-situ observations in the Kuroshio/Oyashio and their originating regions where are possibly vertical mixing hotspots in order to quantify the hypotheses that vertical mixing nutrient supply sustains ocean blessings. These regions include bordering waters of adjacent countries as Russia and China. To make further progress the cooperative research we have made, borderless observations will be performed. To elucidate the mechanism to sustain high biological productivity and its variability, time-series analyses for nutrients and biological processes will be performed by mooring autonomously up-and-down profilers and traps for catching sinking biological particles together with satellite and ship biological observations. Also by developing an isotope analysis method of recovering environmental history from fish otolith for searching environments favorable for fish survival, this project challenge fisheries stock variability.
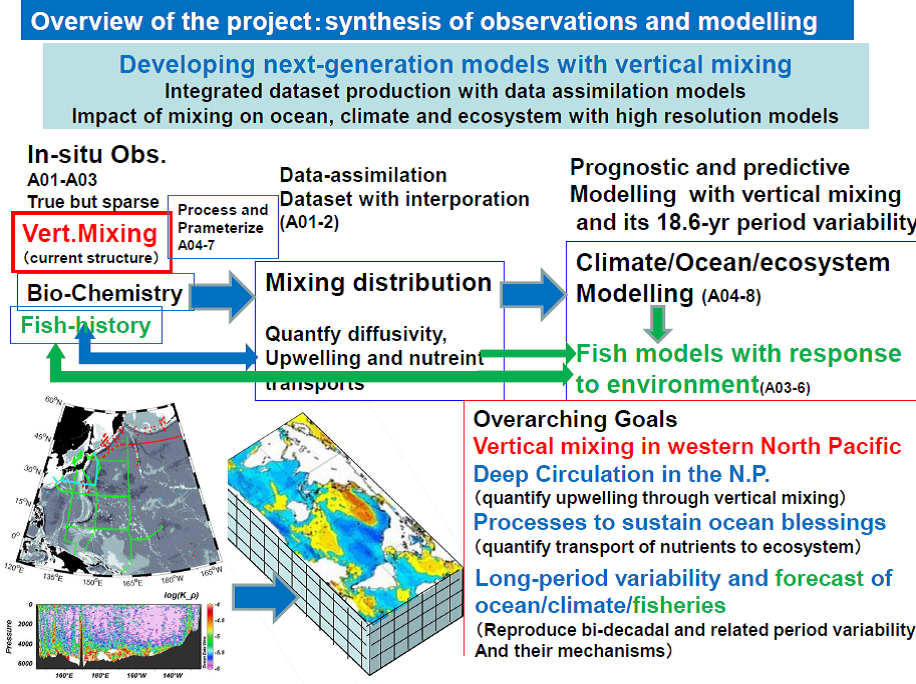 Let me explain the project overview. This project synthesizes observation and modeling to accomplish goals. From in-situ observations of vertical mixing, formulating the relationship between mixing and current structure, 3 dimensional distribution of vertical mixing in the western North Pacific is inferred with the help of tidal simulations and data-assimilation models. Together with biological and chemical observations and other available observations, integrated dataset, which is consistent with observations and conservation principles, is produced through data-assimilation, to yield quantitative North Pacific deep circulations and mechanisms to sustain ocean blessings. By changing the vertical mixing with the 18.6-year period, climate, ocean and ecosystem models are driven to reproduce long-period variability and link the ocean/climate variability processes with 18.6-yr mixing variability. Fish models with the fish response to environments detected from fish-otolith analysis is driven in the above modeling output, links between fish survival and 18.6yr mixing variability are examined to open long-term fisheries forecasts. These new models with vertical mixing is capable to reproduce vertical transports of heat and materials and be used for long-term forecasts.
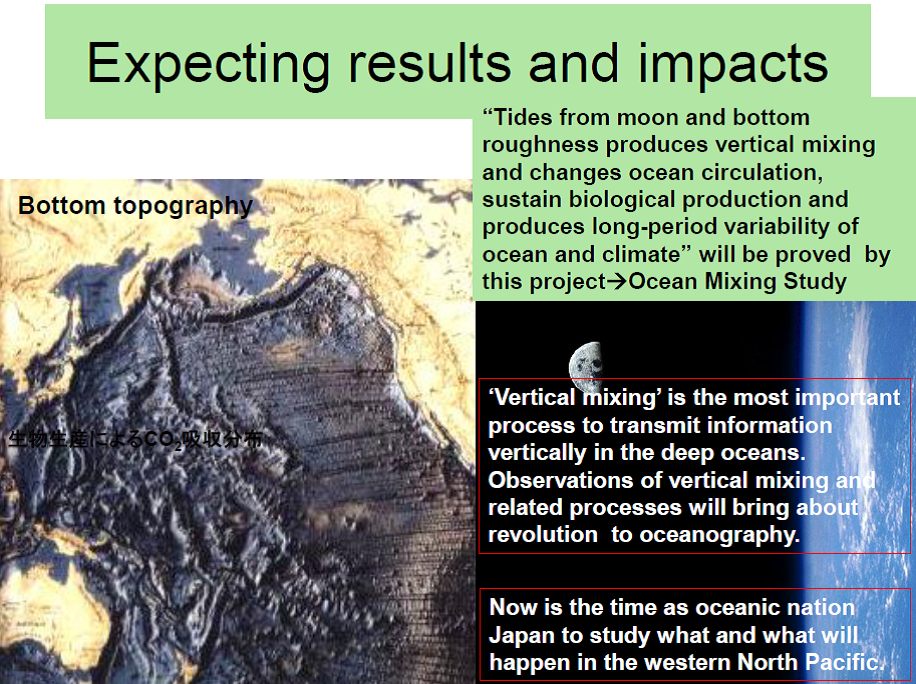
Let me summarize the expecting results and impacts. Tides from moon and bottom roughness interactions produce vertical mixing and change ocean circulation, sustain biological production and produce long-period variability of ocean and climate. Those will be proved by this project and create “Ocean Mixing Study”. ‘Vertical mixing’ is the most important process to transmit information vertically in the deep oceans. Observations of vertical mixing and related processes will bring about revolution to oceanography. Now is the time as oceanic nation Japan to study what and what will happen in the western North Pacific.


© 2025 海洋混合学の創設. All Rights Reserved.